
This page gives a little more detail about the way I generate an accurate colour on screen starting from a single wavelength colour from the spectrum.
In order to produce a rainbow across a number of pixels, it is necessary to know how many pixels there are, and what range of wavelengths to employ. A wavelength is calculated for each pixel in turn and a colour is then obtained based on the required wavelength for that pixel.
Firstly the CIE Tristimulus XYZ values are obtained for each of the chosen wavelengths; the original values are in a three-dimensional table in 5 nanometer increments. For wavelengths between 5nm steps, it is assumed that there is a linear change from one step to the next. For instance, a wavelength of 430nm has X, Y, and Z values of 0.3147, 0.0387, and 1.5535, and a wavelength of 435nm has X, Y, & Z of 0.3577, 0.0496, and 1.7985. For a wavelength of 433.69 nm, linearly interpolated values between 430 and 435 nm are used, being 0.34652, 0.046766, and 1.7348 respectively. Once this is done, the x,y, and z Chromaticity coordinates can be calculated. This is done by adding together X, Y, and Z and expressing each as a proportion of the total to give the values known as x, y, and z (lower case letters).
| Wavelength | X | Y | Z | x | y | z |
| 430.00 nm - Original Data | 0.3147 | 0.0387 | 1.5535 | 0.165 | 0.020 | 0.815 |
| 433.69 nm - Extrapolated Data | 0.34652 | 0.046766 | 1.7348 | 0.163 | 0.022 | 0.815 |
| 435.00 nm - Original Data | 0.3577 | 0.0496 | 1.7985 | 0.162 | 0.022 | 0.815 |
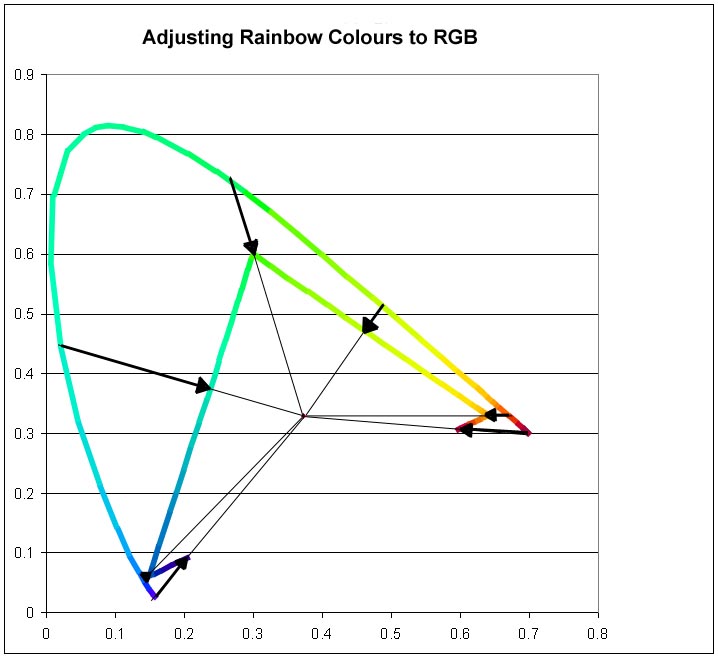
Once this is done we only need two of those values, since the third may readily be calculated given the other two. By convention we choose to use x and y to plot each colour on a two-dimensional Chromaticity Diagram. For the example of 433.69nm, the three x, y, and z values are 0.163, 0.022, and 0.815 respectively and we use x and y (0.163 and 0.022) to plot the chromaticity. Since in all cases, colours calculated in this way will be outside any possible RGB gamut, in order to be able to represent any such colour on screen it is necessary to alter it to the closest in-gamut colour. Working with x and y coordinates, we move the point on the 2-dimensional x & y chromaticity diagram towards the white point of the current system until it intersects the triangle between the chromaticities of the red, green and blue primaries in the colour space being used. I do this by testing for whether the colour chromaticity point and the white point are on the opposite sides of each line between the three primary colours (above in the case of blue/green and green/red, and below for blue/red), and adjusting the colour to the point of intersection between this line and a line between the colour and the white point. Thus, the chromaticity of all colours will then lie on the triangle formed by the red, green and blue points.

Each wavelength colour is adjusted towards the white point of the currently defined colour system
until it can be represented by a combination of R, G, and B.
In the example above, the point represented by the chromaticity of the colour observed at 433.69nm (a colour close to the violet end of the spectrum) is adjusted from {0.163, 0.022} to {0.192, 0.083} because it is below the blue/red line.
Once the colour has been corrected to be in-gamut (in chromaticity terms), the RGB may be obtained. There are various ways this can be done, but at present I use some code that produces good results as far as fundamental colour is concerned, but makes all colours of uniform brightness. This is good for the main spread of the spectrum, but useless at each end where we want colours at the extreme red and blue ends of the spectrum to fade to black. I have therefore added functions to fade the ends of the spectrum (linearly) between arbitrary wavelengths at each end.
The result is a representation of the full spectrum of rainbow colours that is, I believe, as good as it is possible to get bearing in mind the limitations of an RGB system.
